# https://stackoverflow.com/questions/77505716/how-to-add-count-labels-to-faceted-likert-plot-ggstatsgglikert
#remotes::install_github("larmarange/ggstats")
library(ggstats)
library(ggplot2)
library(dplyr)
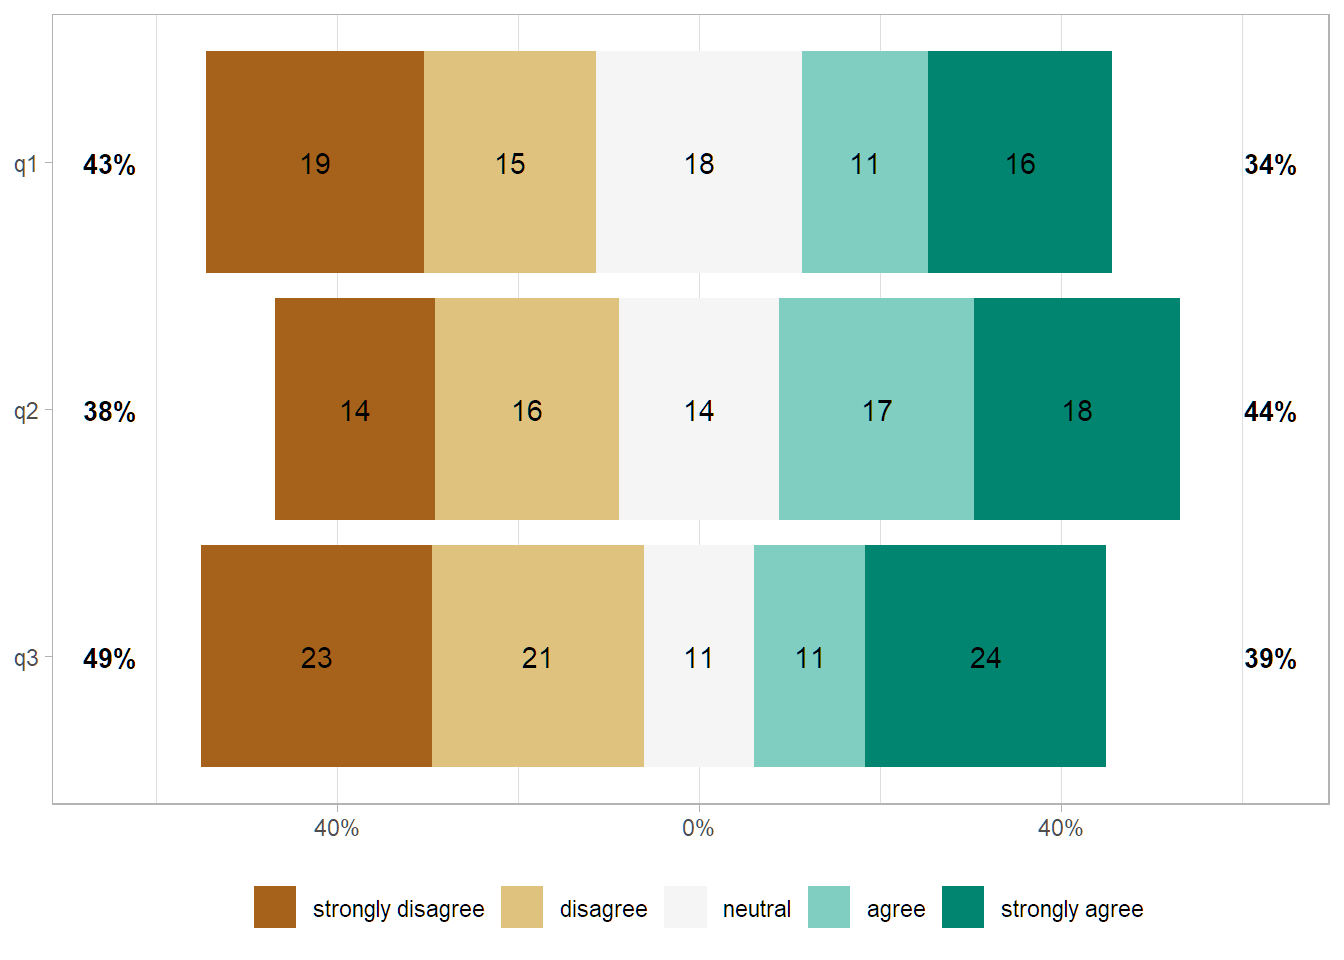
likert_levels <- c("strongly disagree", "disagree", "neutral", "agree", "strongly agree", NA)
set.seed(123)
df <- data.frame(
q1 = sample(likert_levels, 100, replace = TRUE),
q2 = sample(likert_levels, 100, replace = TRUE),
q3 = sample(likert_levels, 100, replace = TRUE),
group = sample(c("pre", "post"), 100, replace = TRUE)
) |>
mutate(across(-group, ~factor(.x, levels = setdiff(likert_levels, NA))),
group = factor(group, levels = c("pre", "post")))
p <- gglikert(
data = df,
include = q1:q3,
add_labels = FALSE
)
p_df <- layer_data(p)
p_df$correct_x <- (p_df$xmax + p_df$xmin) / 2
p + annotate(geom="text", x = p_df$correct_x, y = p_df$y, label = p_df$count)