# https://stackoverflow.com/questions/77600362/adjusting-the-size-of-several-pie-charts-in-ggplot2
library(dplyr)
library(ggplot2)
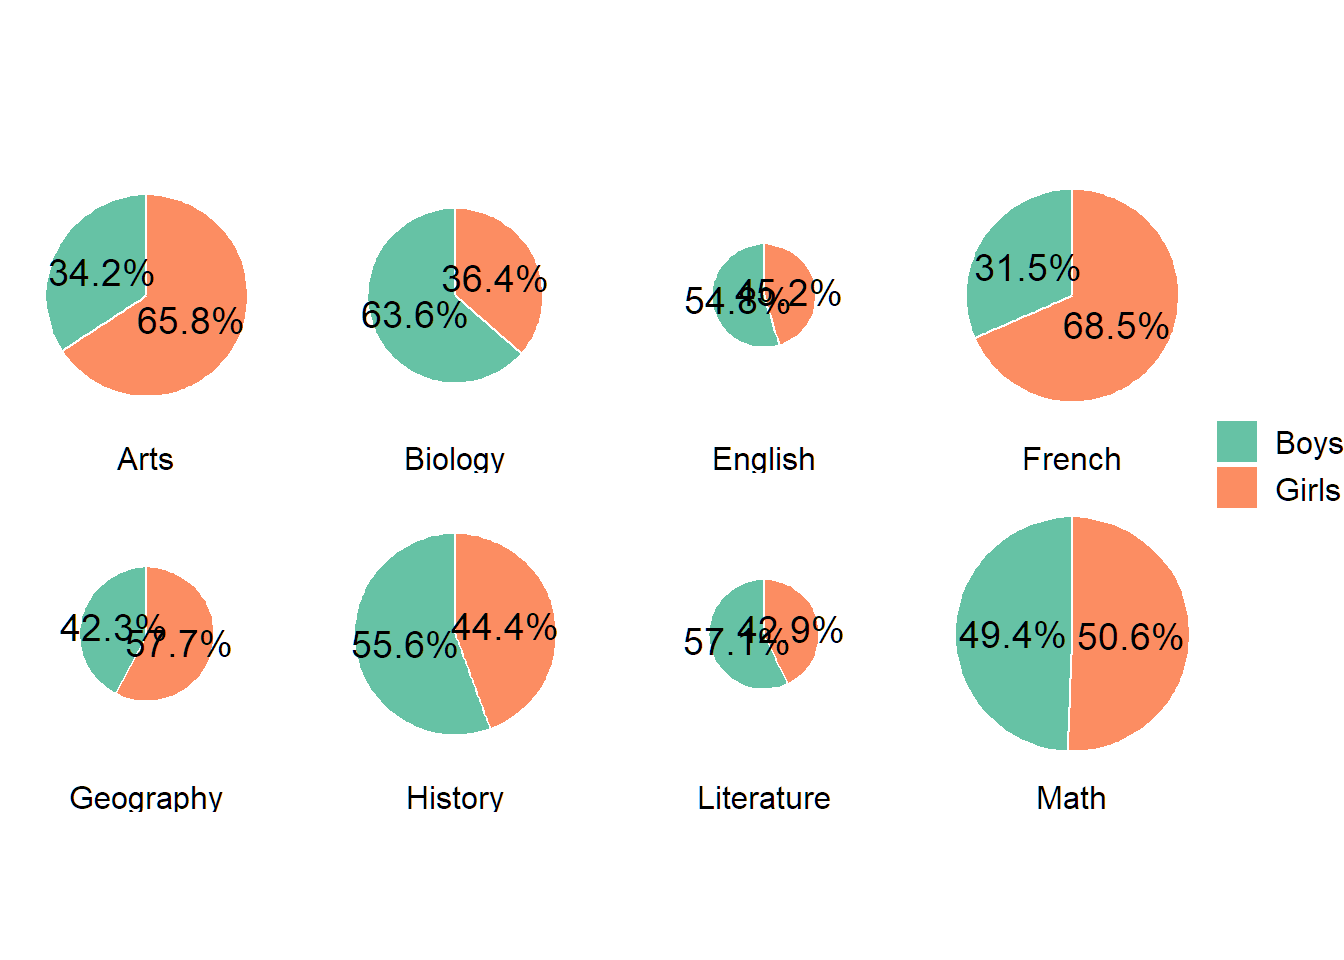
df <- data.frame(Subjects = c("Literature", "Literature", "Geography", "Geography", "Arts", "Arts",
"English", "English", "Math", "Math", "History", "History",
"Biology", "Biology", "French", "French"),
Sex = rep(c("Girls", "Boys"), 2),
N = c(15, 20, 30, 22, 77, 40, 14, 17,
80, 78, 52, 65, 32, 56, 89, 41)) |>
group_by(Subjects) |>
mutate(pct = proportions(N) * 100) |>
mutate_at(vars(pct), list(~ round(., 1))) |>
ungroup()
df |>
mutate(size = sum(N), .by = Subjects) |>
ggplot(aes(x = sqrt(size)/2, y = pct, fill = Sex)) +
geom_col(aes(width = sqrt(size)), color = "white",
na.rm = TRUE) +
coord_polar("y", start = 0) +
facet_wrap(~ Subjects,
ncol = 4,
strip.position = "bottom") +
geom_text(aes(y = pct, label = paste0(pct, "%")), size = 5,
position = position_stack(vjust = 0.5))+
theme_void() +
theme(legend.title=element_blank(),
strip.text = element_text(size = 12)) +
theme(plot.title = element_text(hjust = 0.0),
legend.text = element_text(size = 12),
legend.spacing.y = unit(0.0, 'cm'),
legend.box.spacing = unit(-2, "pt")) +
guides(fill = guide_legend(byrow = TRUE)) +
scale_fill_brewer(palette = "Set2")